

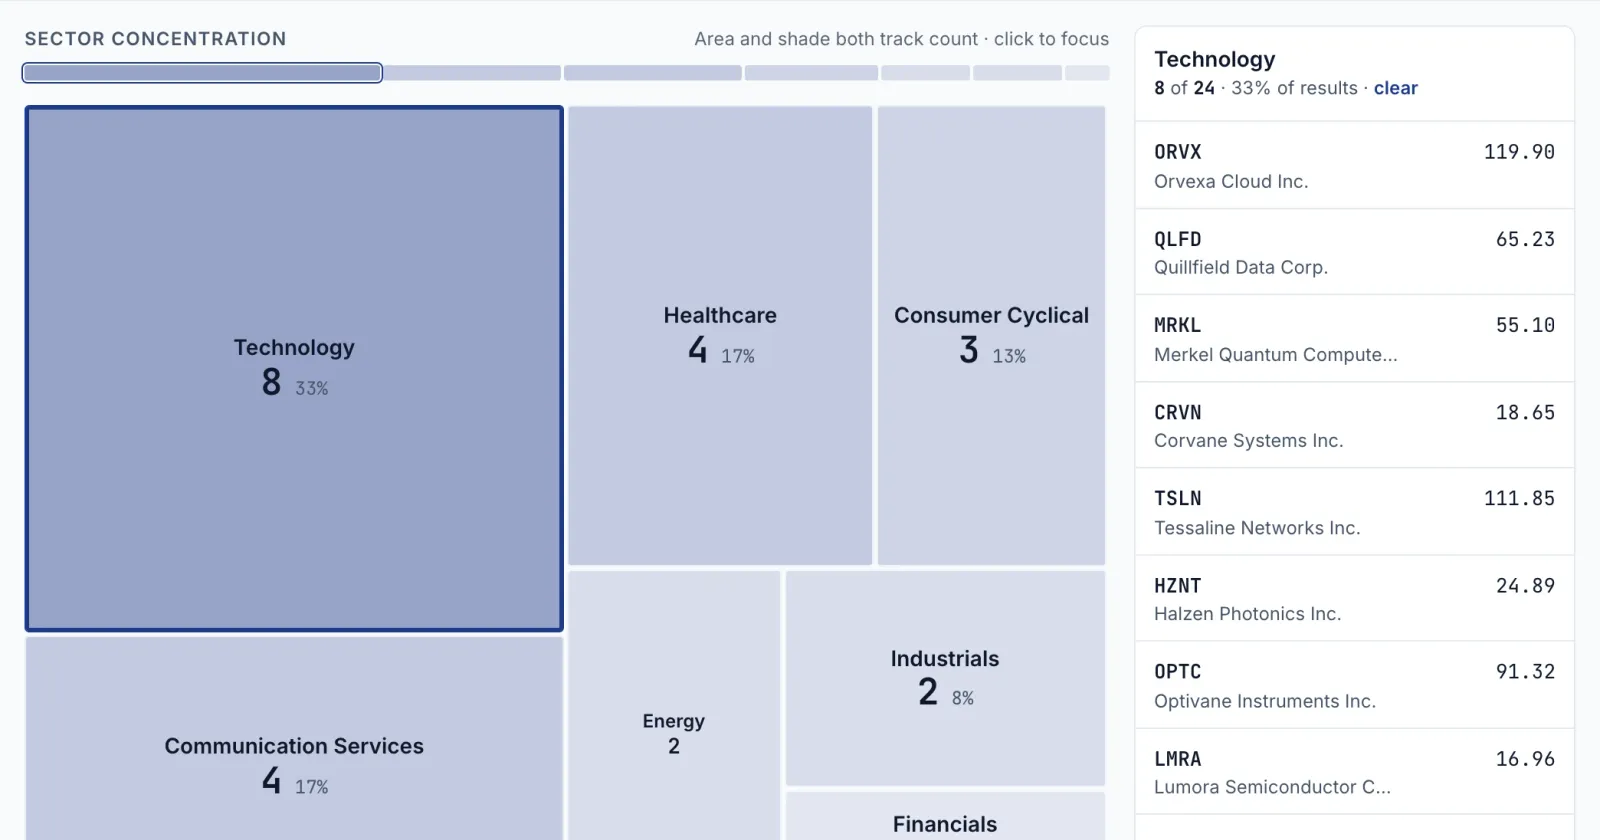
Qullamaggie’s public breakout approach starts with the strongest stocks over one, three and six months, followed by a search for tightening consolidations. StocksDome can approximate that process with performance rankings and chart review. The screen below finds candidates, not confirmed breakouts or instructions to trade.
Key points
- His published scan looks for the top 1% or 2% of performers over separate timeframes.
- A strong prior move is only the start. Higher lows and a tightening consolidation need chart review.
- The example’s liquidity and volatility thresholds are editorial settings, not his exact rules.
- A top-percentage limit applies after the conditions, so the filtered universe matters.
What is Qullamaggie’s breakout setup?
In his January 8, 2021 setups article, Kristjan Kullamägi, known as Qullamaggie, describes a sequence: a strong advance, an orderly pause, then a fresh move out of that pause.
He describes an initial advance of 30%–100% or more sometime in the preceding one to three months. Next comes a consolidation, usually lasting two weeks to two months, with higher lows and a tightening range. A consolidation is a pause in the trend; tightening means the price swings become smaller. The eventual breakout is a move beyond that consolidation’s boundary.
His guide also describes price following rising 10- and 20-day moving averages, sometimes the 50-day average. These averages smooth recent prices to help show the trend. They are context for the pattern, not proof that another advance will follow.
That distinction matters at the open. A stock can rank among the strongest performers while still moving sharply without a pause. The search needs to separate a leader building a base from one that has not yet consolidated.
How does Qullamaggie find momentum stocks?
The same guide calls for scanning the top 1% or 2% of gainers over one, three and six months. These are separate searches. Requiring a stock to lead on every timeframe would be a stricter rule than the one described.
His public material is not a single permanent scanner preset. In My scanning process and scans, uploaded March 13, 2017, he discusses multiple scans with differing liquidity and range requirements. That supports using a defined process, not presenting one copied threshold as universal.
His FAQ defines average daily range, or ADR, as a percentage based on the past 20 sessions’ high-to-low ranges. ADR describes typical daily movement; it does not establish that a consolidation is orderly or that the next move will be upward.
Building a similar screen in StocksDome
This is an independent approximation of the published approach. It is not his saved scanner, and it does not imply that he uses or endorses StocksDome.
Open Screener, then New screen. Under Start from, leave Symbols to scan empty for All symbols, or choose a watchlist that defines the stock universe to review. Keep that choice consistent across the timeframe variants.
For a concrete illustration, set Keep stocks where to match all of these conditions:
| Data point | Comparison | Value |
|---|---|---|
| Avg $ Volume | is above | 10,000,000 |
| ADR % | is above | 3 |
| Perf 1M | is above | 0 |
Watch the results with Run screen, using Charts or a quick-look chart to review each candidate before adding it to a watchlist.
The dollar-volume floor, ADR cutoff and positive-return condition are this article’s sample settings, not Kullamägi’s published requirements or tested thresholds. They illustrate how to narrow the universe by trading activity, daily movement and a positive prior move. Check and record the measures’ displayed settings; an indicator name alone does not establish an identical calculation across platforms.
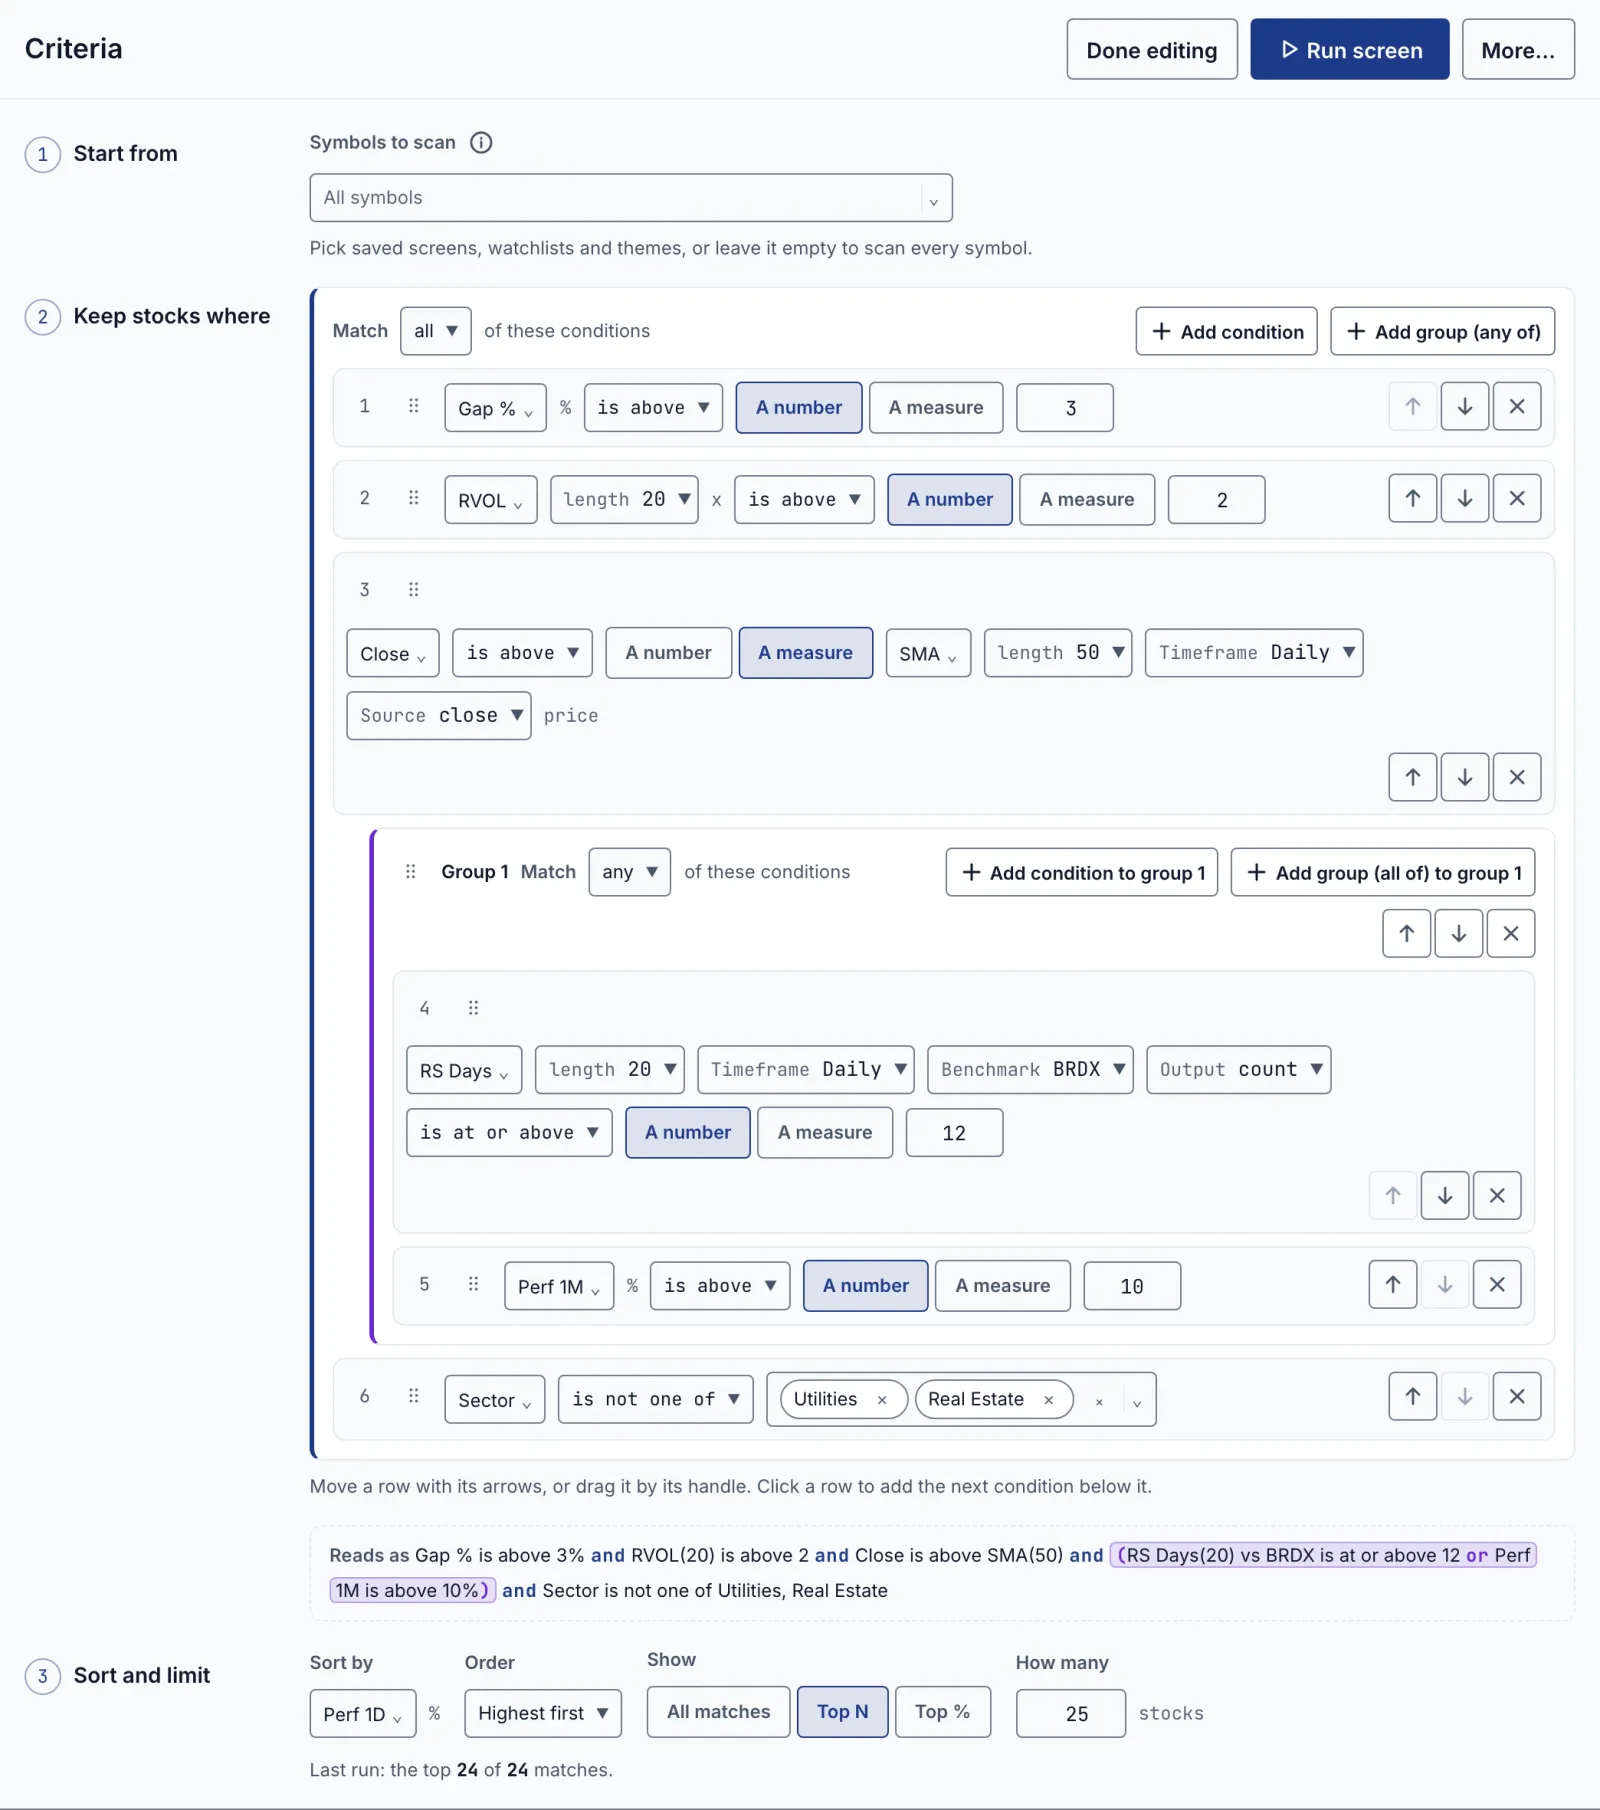
The condition builder groups the tests and reads them back under Reads as. The illustration below shows the editor, not the particular conditions in this recipe.
Next, use Sort and limit:
- Set Sort by to Perf 1M and Order to Highest first.
- Set Show to Top % and How many to 2.
- Select Run screen, then Save and name the screen.
- Make separate copies through More… → Save as…. In one, change both the performance condition and ranking to Perf 3M; in the other, change both to Perf 6M. Run and save each version.
Review all three result lists, adding suitable candidates to a common watchlist. A stock need not appear in every list.
There is an important denominator here: Top % keeps a percentage of the stocks that passed the conditions. This recipe therefore finds the top 2% of its filtered matches, not the top 2% of the entire market. Changing the universe or filters changes what leadership means.
Also, the ranking chooses which stocks survive the limit; it does not set the table’s initial order. Select the relevant performance column heading to inspect the results by return. For session monitoring, Re-run every controls fresh screening and Keep rows in place prevents table rows from moving while their values update.
What still needs chart review?
The recipe does not test the full sequence of advance, pullback, higher lows and tightening swings. An ADR filter measures range, not the shape of a base. A performance filter cannot tell whether the most recent candles form a consolidation.
For each result, the useful questions are concrete:
- Is there a distinct pause after the prior advance?
- Are successive pullback lows rising, or is the base becoming less orderly?
- Are the swings tightening toward a clear upper boundary?
- Is price still near that boundary, or has it already moved far beyond it?
The available Tight Setup Day field is not a documented substitute for Kullamägi’s complete pattern. Likewise, ADR % is a related measure, but the available product reference does not establish that it reproduces his FAQ’s calculation. This recipe makes no formula-equivalence claim.
When the chart does not answer the pattern questions clearly, the screen has supplied a research candidate and nothing more.
Why does entry distance matter for breakout risk?
In his 2021 guide, Kullamägi describes entries around opening-range highs and an initial stop at the day’s low. The opening range is the price range formed during a chosen interval after the open. He also says the stop distance should not exceed the stock’s ADR or average true range, another range measure.
Those are his stated trade-management rules, not instructions for the reader. Their relevance to screening is that a good-looking base and an acceptable entry are different questions. As price moves away from the day’s low, the distance to that reference point grows.
A planned stop is not a guaranteed maximum loss. The SEC’s Investor.gov explanation notes that a stop order becomes a market order when triggered, and market orders do not guarantee an execution price. Screening does not remove that execution risk.
No hit rate or return is claimed for this approximation. It is a repeatable way to assemble a review list, not evidence of a trading edge.
FAQ
Is this Qullamaggie’s exact screener?
No. It uses his published performance-ranking idea with explicitly labelled sample filters. The complete pattern still requires chart review, and the implementation does not imply endorsement.
Must a stock lead over all three timeframes?
Not in the approach described here. Review the one-, three- and six-month lists separately; requiring membership in all three changes the search.
Does ADR above 3% identify a breakout?
No. That is this example’s volatility cutoff, not a breakout signal or a universal Qullamaggie rule. It does not test higher lows or consolidation quality.
Does passing the screen mean a stock is ready to trade?
No. A match passes the numerical tests only. Pattern quality, entry distance and execution risk remain separate questions.
Sources
- 3 timeless setups that have made me tens of millions, Qullamaggie, January 8, 2021.
- My scanning process and scans, Qullamaggie on YouTube, March 13, 2017.
- Frequently Asked Questions, Qullamaggie, undated; accessed November 17, 2026.
- Types of Orders, U.S. Securities and Exchange Commission, Investor.gov, undated; accessed November 17, 2026.
- Screening, StocksDome, undated; accessed November 17, 2026.
This article is for information only and is not investment advice.